
One of our primary goals is to develop tools for analyzing and understanding medical images. In particular, we have developed software in the following areas:
Developed by the Laboratory of Brain Anatomical MRI, these tools allow users to process large multimodal datasets between subjects.
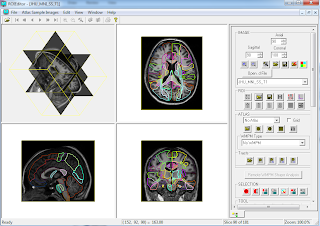
- MRI Studio: This software package combines DTI analysis using DTI Studio, inter-subject co-registration with LDDMM using DiffeoMap, and drawing or editing regions of interest with ROIEditor.
- Platform: Windows
- Supported Data Types: GE, PHilips, Siemens, Toshiba, DICOM, raw, Analyze, NIfTI, NRRD
- Note: When downloading and installing the different modules of MRI Studio, each software .exe is a .zip folder that contains the software application and an "Images" folder with the atlas templates. These atlas templates include the "Eve Atlas" in the folder "JHU_MNI_SS," featuring a single-subject female brain in Montreal Neurological Institute (MNI) coordinates, with contrasts from diffusion weighted imaging, T1-weighted imaging, T2-weighted imaging, the magnitude image of a gradient-recalled echo, and a quantitative susceptibility map.
- This "JHU_MNI_SS" folder also includes region of interest maps with the ".roihdr" extension, namely the "BPM" ("Brain Parcellation Map," with regions of interest drawn with reference to the Eve Atlas), the "EveDGMPM" ("Eve Deep Gray Matter Parcellation Map," with deep gray matter ROIs drawn using QSM contrast), and the "EvePM" (an atlas containing deep gray matter regions from the EveDGMPM and white matter ROIs from the BPM). The regions of interest themselves are labeled in the accompanying text document "Lookup Tables."
- If you are looking for information on the Eve atlas for Quantitative Susceptibility Mapping, please refer to our paper: Human brain atlas for automated region of interest selection in quantitative susceptibility mapping: Application to determine iron content in deep gray matter structures. Instructions on how to use the EveGreMag and EveRefQSM templates can be downloaded at the bottom of this webpage, from this link (Google Docs .pdf), or from this link (.pdf).
Developed by the Laboratory of Brain Anatomical MRI, these tools can process DTI data and reconstruct three-dimensional fiber trajectories. Please use this website's sidebar menu to find the following:
- MRIStudio: This MRIStudio software package incorporates the former DTIStudio, which can be used to load images, rotate volumes, create color maps, find tracts through a region of interest, etc.
- Platform: Windows
- Supported Data Types: GE, PHilips, Siemens, Toshiba, DICOM, raw, Analyze, NIfTI, NRRD
Drs. Bennett Landman and Jonathan Farrell have also developed software for analyzing DTI data:
- CATNAP: Coregistration, Adjustment, and Tensor-solving, a Nicely Automated Program
- The BIRN site displays details about this particular tool, as well.
These free online simulations were developed in Python by research associates Drs. Nirbhay Yadav and Craig Jones:
- Simulate CEST Z-spectra using Bloch Equations: Users can input several properties of the water pool, solute pool, and experimental parameters, then see how each variable affects the the Z-spectra.
- Platform: Web-based (runs online using python)
- Supported Data Types: Users input individual parameters to create a simulation
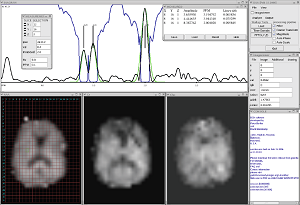
This package of CEST Data Processing Tools was developed by Drs. Guanshu Liu & Michael McMahon for the display and analysis of in vitro and in vivo CEST imaging datasets using the commercially available Matlab program. Three Matlab scripts are included in this package:
- preprocess.m for SNR based thresholding and manually defining regions of interest (ROI) that will be analyzed in the next steps.
- B0map.m to produce a B0 map by pixelwise fitting the WASSR data sets collected.
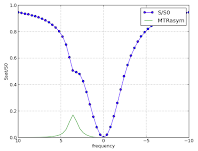
- CEST_processing.m to perform quantitative z-spectral analysis on frequency-swept CEST data sets. The following actions are performed: 1) correct B0 inhomogeneities pixelwise; 2) display plots of the z-spectrum and MTRasym for a defined ROI; and 3) display MTRasym maps.
A PDF manual and an example data set for the purpose of testing (phantom acquisition of 31.2 mM myo-inositol solutions in PBS with pH ranging from 5.0 to 7.8) are included.
These software packages were developed by the Center for Imaging Science at Johns Hopkins University.
- CAportal: The Computational Anatomy Portal: The Computational Anatomy Portal provides access to the Atlases, Pipelines, Projects and Tools developed at the Johns Hopkins University Center for Imaging Science. Links are also provided to Computational Anatomy Processing Portals.
- Large Deformation Diffeomorphic Metric Mapping (LDDMM) Suite: These algorithms incorporate the volume, surface, similitude, landmarks, and DTI information in a dataset.
- CIS Software: Other packages from the CIS include a Rigid Landmark Matching (RLM) tool, CAWorks, BrainWorks, and MindView.
- Overall Platforms: Linux, Windows, Mac OSX
- Supported Data Types: DICOM, raw, Analyze, NIfTI
XNAT is an open source imaging informatics platform, developed by the Neuroinformatics Research Group at Washington University. XNAT can be used to support a wide range of imaging-based projects to facilitate common management, productivity, and quality assurance tasks for imaging and associated data. The Center for Imaging Science presented a poster in 2011 with additional information for accessing XNAT in CA Works.
- Accessing XNAT in CA Works: Accessing XNAT through CA Works to support imaging-based projects
- Platforms: Linux, Windows, Mac OSX
- Supported Data Types: VTK MultiBlock
These software packages were written by Peter Barker, DPhil. They are available for use on systems associated with the F. M. Kirby Center and the JHU Magnetic Resonance Division. Registered users may download them for free.
- CSX
The CSX program was developed for the display and analysis of in vivo spectroscopy and spectroscopic imaging datasets.- CSX: First Generation CSX
- Initially developed in the OpenWindows environment of Sun Microsystems SunOS 4.x on Sparc computers.
- Code compiled for Silicon Graphics IRIX6 system.
- CSX2: Second Generation CSX
- Built for Sun UltraSparc Solaris 2.x and Linux systems
- CSX3: Third Generation CSX
- Built for Sun UltraSparc Solaris 2.x and MacOSX systems
- Platforms: Unix, MacOSX
- Supported Data Types: GE, Philips, Siemens, DICOM, raw
- CSX: First Generation CSX
- IMAX
The IMAX program displays images, and is to be used in conjunction with CSX. This program allows users to overlay images with MRSI "grids," with a "point-and-click" selection of spectra from regions of interest. Regions of interest can also be measured, added, subtracted, or combined. IMAX supports the following file formats: General Electric SIGNA (3.X, 4.X, or 5.X image files), DICOM, and SMIS (.sur). A general import tool allows the importing of data in other formats, such as ASCII, short integer, integer, floating point, double, and any header offset or matrix size. - DSX
The DSX program combines the functionality of CSX and IMAX. It was based on the CSX processing and analysis code, but has a new graphical user interface (GUI). It was developed for x86 Windows and Linux systems. Developed by Drs. Peter Barker and David Bonekamp at Johns Hopkins Hospital in Baltimore, MD, USA.- Platforms: X86 Windows, Linux
- Supported Data Types: GE, Philips, Siemens, DICOM, raw
- Gannet: GABA-Edited MRS Analysis
This software package was written by Richard Edden, PhD and John Evans, PhD of Cardiff University, UK. Gannet is a batch analysis tool for GABA-edited MRS, written in MATLAB (so it can be implemented in any operating system, so long as MATLAB is installed with Optimization and Statistics tollboxes). It is freely available to registered users through the blog http://gabamrs.blogspot.com.- Platform: Cross-Platform in MATLAB
- Supported Data Types: GE, Philips, Siemens
These subroutines and software for image analysis were produced by the SMART group.
- SMART Software & Tutorials
The SMART website contains downloadable subroutines for a variety of imaging analysis tasks as well as video tutorials on visualization and software usage.- Platform: Cross-Platform in R
- Supported Data Types: NIfTI
- Aaron Fisher's ggbrain suite of R functions for plotting brain images using R
- Shaojie Chen's pgica for parallel group ICA
- Mandy Mejia's shrinkit and shrinkR for shrinkage estimation for clustering
- John Muschelli's collection of software for visualizing and analyzing brain imaging data in R
MriCloud is our new platform-free image analysis software based on a cloud architecture. Currently its Software-as-a-Service (SaaS) is provided through a website, www.mricloud.org and offers the following services:
- Fully automated cloud service for brain parcellation of MPRAGE images based on Multiple-Atlas Likelihood Fusion (MALF) algorithm, JHU multi-atlas inventories with 286 defined structures, and our Ontology Level Control (OLC) technology.
- Fully automated cloud service for DTI tensor calculation and extensive quantitative reports for quality control.