Blood brain barrier (BBB) water permeability MRI
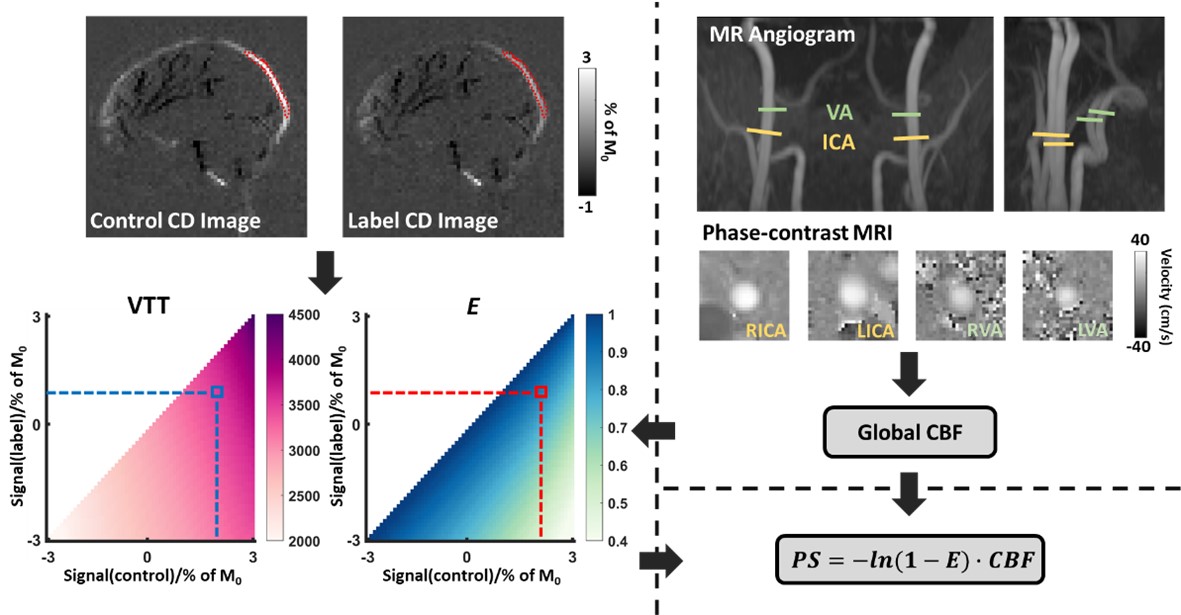
Contrary to other organs, the brain has a vascular barrier. This BBB prevents certain molecular species, viruses, or bacteria from entering the brain. An intact BBB is critical in protecting the brain from infection and inflammation. BBB disruption has been associated with many pathological conditions. Therefore, the availability to monitor BBB permeability in humans has tremendous potential in clinical applications. We will have previously developed a non-contrast MRI method, Water-extraction-with-phase-contrast-arterial-spin-tagging (WEPCAST), to measure BBB permeability to water. This method measures the amount of arterially labeled signal that reaches the vein compared to those entering the tissue. In our ongoing effort, we are working to improve the measurement reliability of our previously developed WEPCAST technique, reduce variability across individuals, and develop regional BBB permeability assessment. In the example illustrated below, we propose a framework to estimate the BBB permeability. First, phase-contrast quantitative flow data are used to estimate cerebral blood flow (CBF). Next, we generate a dictionary using a simulation that provides a one-to-one correspondence between the MRI signals and the estimated parameters: venous transit time (VTT) and water extraction fraction (E). Then, WEPCAST control and label signals are obtained from the superior sagittal sinus (SSS). Using the dictionary, VTT and E are estimated. Finally, using E and CBF, the BBB permeability surface area product (PS, in ml/100g/min) is computed using the Renkin-Crone equation.
Arterial Spin labeling (ASL) MRI to assess water exchange between tissue and cerebrospinal fluid (CSF)
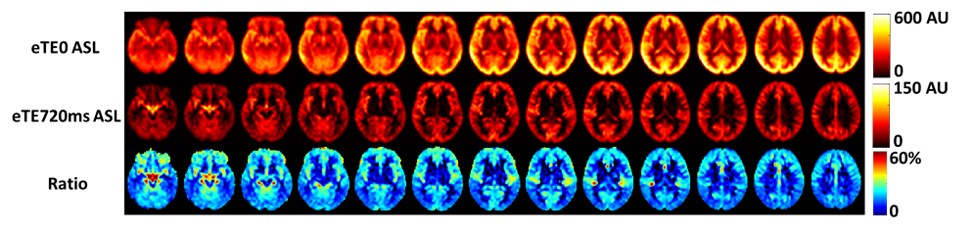
The brain’s glymphatic system has received increasing interest with a number of techniques being developed to measure the exchange among tissue, blood, and CSF. Here, we introduce a new technique to measure an index of tissue-CSF exchange, referred to as CSF signal fraction in ASL. The general principle is to use ASL to generate an intrinsic tracer of water molecules and allow them to enter the brain tissue via perfusion. From there, we measure how many of these labeled water molecules will enter the perivascular space through tissue-CSF exchange. One can expect that, when the tissue-CSF exchange is impaired, a smaller amount of water will be able to enter the perivascular CSF space. To separate the water molecules in the CSF space from those remaining in the tissue, we use a long echo time (TE) T2-preparation, exploiting the drastic difference in T2 value between tissue and CSF. Figure below shows preliminary data from the average of 8 healthy volunteers. We used no T2-preparation (equivalent to eTE=0) and eTE=720ms to suppress the tissue ASL signal.
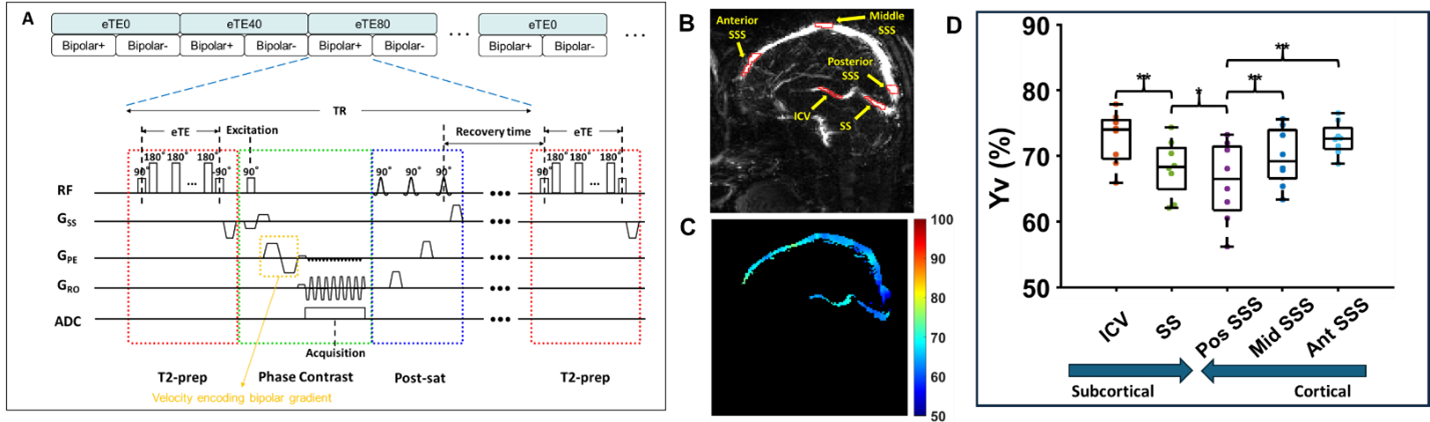
Oxygen extraction fraction (OEF) MRI from cortical and subcortical venous oxygenation
We aim to measure a region-specific venous oxygenation fraction, Yv, while maintaining the short scan time (~1 minute) and excellent measurement accuracy that global methods often afford. We will develop a new pulse sequence referred to as Echo-Planar-Imaging (EPI) -based T2-Relaxation-Under-Phase-Contrast (EPI-TRUPC) for rapid and reliable measurement of blood oxygenation in major draining veins of the brain, e.g., internal cerebral veins (ICV), straight sinus (SS), and SSS. Note that EPI has rarely been used in phase-contrast MRI previously, due to confounding factors associated with EPI-related phase errors. We will examine the reliability of EPI-PC in the context of T2 preparation and develop post-processing methods to mitigate the errors. The EPI-TRUPC sequence aims to estimate Yv based on the notion that blood T2 and oxygenation have an established relationship. The sequence diagram of EPI-TRUPC is illustrated in Figure below. Preliminary studies have been performed in 8 healthy volunteers. A representative Yv map is illustrated in the figure. The Yv values of ICV, SS, posterior SSS, middle SSS, and anterior SSS measured by mid-sagittal EPI-TRUPC were 72.7±4.0%, 68.2±4.3%, 66.1±6.0%, 69.8±4.4%, and 72.6±2.5%, respectively. In the cortical veins, there was a gradient of decreasing Yv from anterior to posterior regions. For the deep veins, ICV had higher Yv than SS Yv.